Inside Project Atlas: anatomically localized detection of six acute abdominal emergencies on CT
How Atlas classifies and localizes six acute abdominal emergencies on CT, what the numbers actually mean, and why anatomy-aware localization and honest external validation matter more than a single headline metric.
The problem
Acute abdominal pain is one of the most common reasons people arrive in the emergency department. CT is central to working these patients up, especially when something time-critical is on the differential: abdominal aortic aneurysm, acute pancreatitis, acute cholecystitis, kidney or ureter stones, acute diverticulitis, or acute appendicitis. A tool that can flag several of these at once, and point to where the finding is, could help triage the reading worklist.
Most prior AI work in this space handles one disease at a time: appendicitis, stones, or diverticulitis [2][3][4]. Those models can be strong on their narrow task, but a one-disease-at-a-time approach is awkward as a general emergency triage layer. Broad multi-condition classifiers exist too [5], but classification alone tells you that something may be wrong without telling you where, which limits how a radiologist or emergency physician can act on it.
What Atlas does
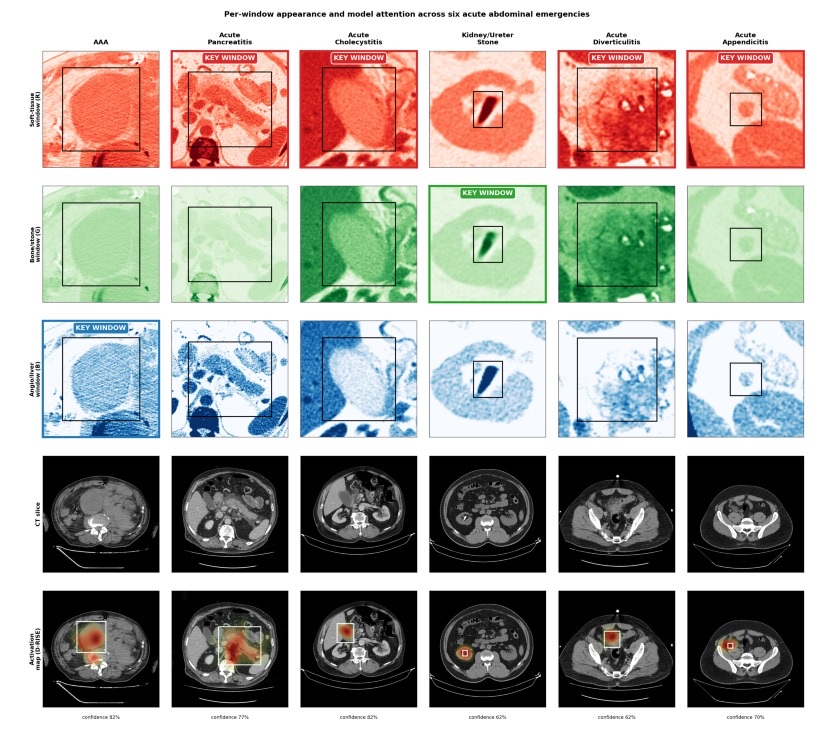
Atlas is built around a simple idea: detection, not just classification, and detection that speaks the anatomic language clinicians already use. For each study it produces three layers of output: a probability for each of the six conditions, a slice-level bounding box showing the image evidence, and a region label that places the finding on the clinical nine-region abdominal grid.
Multi-window encoding
Different abdominal pathologies are conspicuous under different CT windows. Calcified stones jump out on bone windows, inflammatory change reads best on soft-tissue windows, and vascular or parenchymal findings benefit from a narrower contrast-sensitive window. Atlas encodes every CT slice into three diagnostic windows mapped to three image channels: soft tissue, bone and stone, and angio and liver. The approach extends multi-window HU-to-RGB encoding that has been used in brain CT [6] to the abdomen.
In a controlled ablation against an identical single-window grayscale model, the multi-window encoding made little difference to internal performance. Its clearest contribution showed up under cross-cohort transfer, where it produced a small but statistically significant gain in external discrimination, concentrated on the calcified and contrast-anchored classes. In other words, the value of multi-window encoding here is robustness, not a higher internal score.
Anatomy-aware localization
Conventional detection metrics like mAP and IoU are useful for benchmarking but do not match how clinicians describe findings. Atlas maps each detection to the nine-region abdominal grid: the same epigastric, umbilical, hypogastric, hypochondriac, lumbar, and iliac regions used in physical examination and structured reporting [7]. A recent scoping review found that bounding-box localization is still uncommon in abdominal radiology AI [8], so a region-level readout is a practical bridge between model output and the report.
When Atlas detected a pathology, it placed it in the correct region in 99.5 percent of detected cases, and 90.9 percent when missed detections are counted as localization failures. The disease-specific clustering matched clinical expectation: AAA in the umbilical region, cholecystitis in the right hypochondriac region, and appendicitis in the right iliac and lumbar regions.
The numbers, honestly
On a strictly held-out internal test set of 189 patients, drawn from a public national teleradiology dataset [1], Atlas reached a macro AUROC of 0.941 across the six conditions. Per-class discrimination ranged from AAA at 0.998 down to appendicitis at 0.880. Macro F1 was 76.1 percent, and this is where the variation is real: AAA reached 95.5 percent F1 while appendicitis sat at 61.0 percent. We report both numbers rather than just the flattering one.
| Condition | Internal AUROC | F1 |
|---|---|---|
| Abdominal aortic aneurysm | 0.998 | 95.5% |
| Acute pancreatitis | 0.986 | 84.2% |
| Acute diverticulitis | 0.962 | 64.3% |
| Kidney / ureter stones | 0.927 | 81.7% |
| Acute cholecystitis | 0.895 | 69.7% |
| Acute appendicitis | 0.880 | 61.0% |
External validation
Internal numbers are easy to inflate. The harder test is whether a model trained in one country holds up in another with the weights and thresholds frozen. Atlas was applied to a 280-patient cohort from the Stanford AIMI Merlin abdominal CT dataset in the United States [9], adjudicated by a board-certified abdominal radiologist, with no fine-tuning and no threshold re-tuning in the primary analysis.
External macro AUROC was 0.879, with all six classes at or above 0.80 and three at or above 0.90. AAA transferred almost intact, at 0.991 AUROC and 0.889 F1 at the original threshold. Operating-point performance dropped more than discrimination did: macro F1 was 0.545 at frozen thresholds, rising to 0.648 after site-specific recalibration. The lesson is that discrimination transfers reasonably well, but thresholds should be calibrated per site.
Why this matters for deployment
The model is best understood as a triage aid, not a replacement for full CT interpretation. It runs end-to-end on hospital-controlled hardware: with TensorRT FP16 it processes a CT study in a median of about 2.8 seconds on a single consumer GPU, inside the memory envelope of a clinical workstation. Detection confidences were recalibrated with isotonic regression, and decision-curve analysis showed positive net benefit across the prespecified range.
What we are not claiming is just as important. A 13.8 percent per-patient false-positive flag rate on a target-negative cohort means review burden that only a prospective study can properly characterize. Appendicitis remains hard. Diverticulitis was evaluated on a small positive count. These are the honest edges of the work, and they define what comes next.
What comes next
The roadmap is prospective workflow evaluation inside a PACS, protocol-stratified testing, and concrete mechanisms to cut false positives, including organ-level plausibility checks using anatomy segmentation tools such as TotalSegmentator [10]. The goal is not a higher leaderboard number. It is a region-aware triage layer that earns a radiologist's trust by showing its work.
References
- Koç U, et al. Elevating healthcare through AI: the abdominal emergencies dataset at TEKNOFEST-2022. Eur Radiol. 2024;34(6):3588-3597.
- Kim M, et al. Automated 3D CNN for acute appendicitis diagnosis. Sci Rep. 2025;15:7711.
- Ye Y, et al. Kidney stone detection in CT using a YOLOv8 framework. Front Med. 2026;13:1702159.
- Ziegelmayer S, et al. Differentiating colon carcinoma from acute diverticulitis with deep learning. JAMA Netw Open. 2023;6(1):e2253370.
- Rajpurkar P, et al. a2z-1 for multi-disease detection in abdomen-pelvis CT. arXiv:2412.12629. 2024.
- Wang X, et al. Deep learning for acute intracranial hemorrhage on head CT. NeuroImage: Clinical. 2021;32:102785.
- European Society of Radiology. ESR paper on structured reporting in radiology, update 2023. Insights Imaging. 2023;14(1):199.
- Fotis A, et al. From promise to practice: a scoping review of AI in abdominal radiology. Abdom Radiol. 2026;51:1608-1617.
- Stanford AIMI. Merlin Abdominal CT Dataset (v1.0). Redivis; 2026.
- Wasserthal J, et al. TotalSegmentator: robust segmentation of 104 anatomic structures in CT. Radiol Artif Intell. 2023;5(5):e230024.